Projects

Engineering projects

Product, process and plant work — each with the objective, the technologies used, the business impact and the results delivered.

Servo valves, motion control, hydraulics and manufacturing excellence

Servo Valve Repair Excellence

Objective

Standardise the repair, calibration and test process for servo valves so turnaround time and quality no longer depended on individual experience.

Technologies

Servo ValvesHydraulic Test BenchesCalibration KitsRoot Cause Analysis

Business impact

Repeatable repair quality at volume with zero quality non-conformances reported.

Results

  • 1,300+ servo valve repairs completed
  • Zero quality non-conformances
  • Lower customer equipment downtime

Energy Reduction Initiative

Objective

Cut energy consumption across test rigs, hydraulic power units and shop utilities without affecting test throughput.

Technologies

Energy MonitoringHydraulicsKaizenPreventive Maintenance

Business impact

35% reduction in energy consumption and ₹6.7 lakh annual cost avoidance.

Results

  • 35% reduction in energy consumption
  • ₹6.7 lakh annual cost avoidance
  • Standard shutdown and idle-time practice

Barcode Traceability System

Objective

Give every serialised product a digital history of build, test, inspection and repair events across its lifecycle.

Technologies

Barcode ScanningSerial TraceabilitySAPProcess Design

Business impact

Audit-ready traceability and much faster warranty and failure investigation.

Results

  • 1,400+ product inspections traceable per year
  • Faster warranty investigation
  • Audit-ready compliance evidence

Manufacturing Process Improvements

Objective

Improve throughput and first-pass yield on assembly, test and inspection operations for motion control products.

Technologies

Lean ManufacturingSix SigmaLine BalancingFMEA

Business impact

96% resource utilization on automated test cells and steadier output.

Results

  • 96% resource utilization
  • Reduced cycle time per unit
  • Improved first-pass yield

Kaizen Projects

Objective

Run a continuous stream of small improvement projects owned by the people doing the work.

Technologies

Kaizen5SPoka-YokeVisual Management

Business impact

20+ improvement projects delivered with measurable cost, quality or time gains.

Results

  • 20+ improvement projects delivered
  • Shop-floor ownership of improvement
  • Documented standard work

Projects

Analytics projects

Power BI and SQL work built on top of the engineering — reporting that operations, sales and leadership use to decide.

Power BI, SQL, DAX, Power Query and SAP data

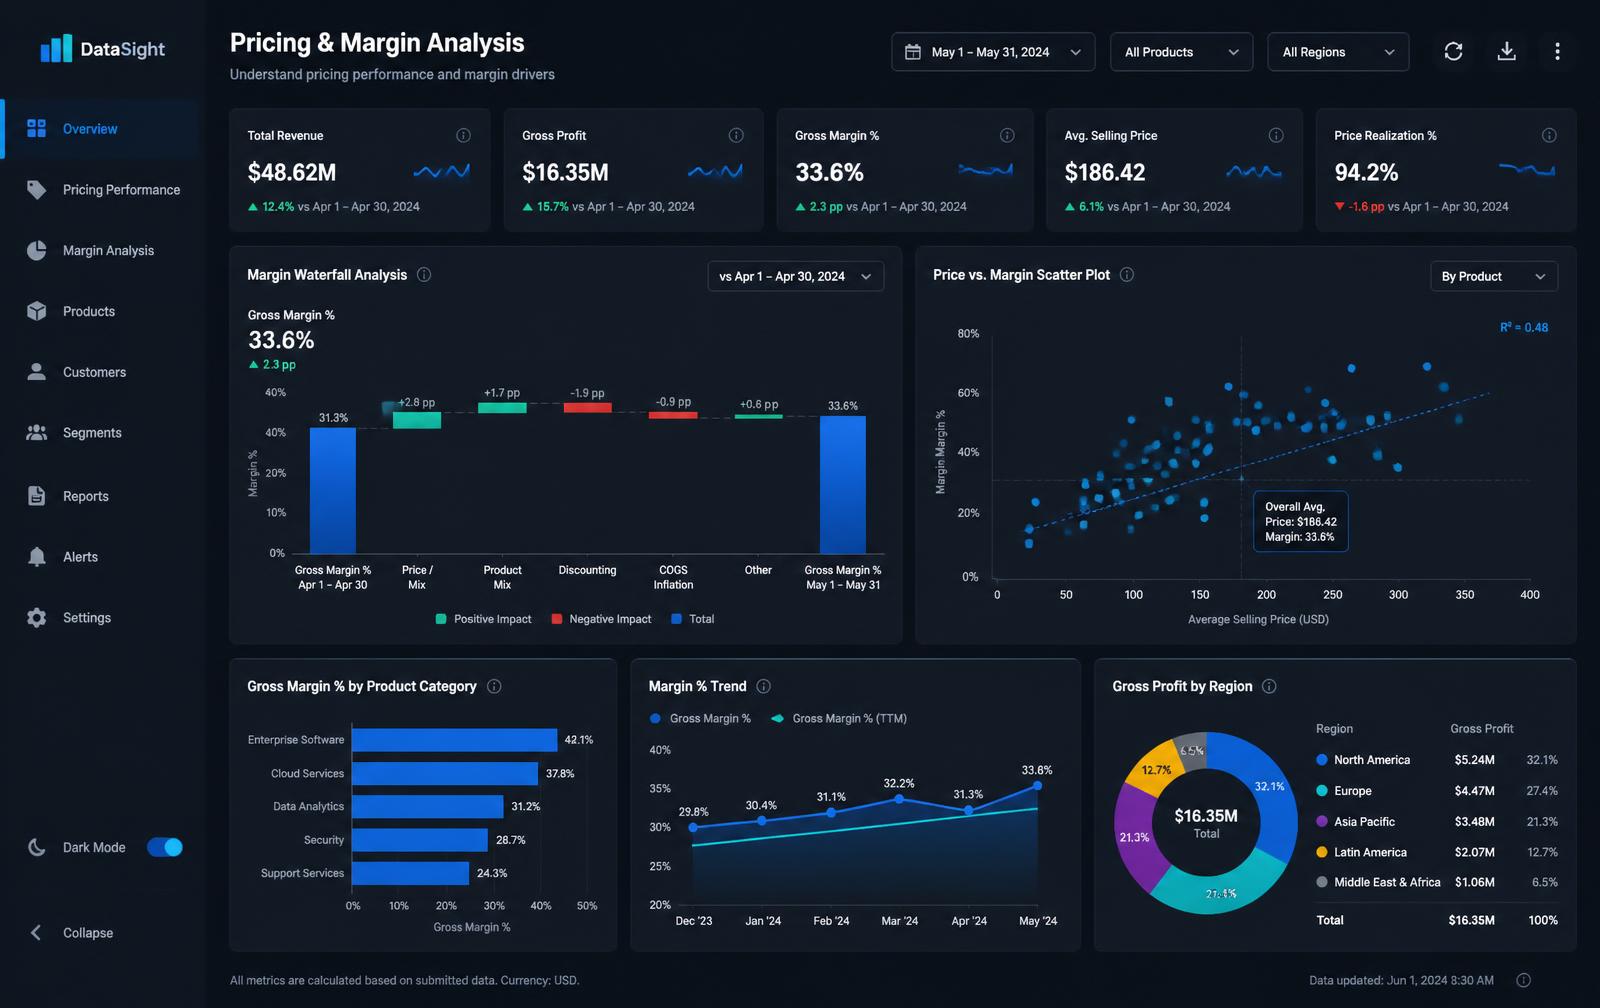
Repair Price List Dashboard

Repair price list dashboard with pricing and margin analysis

Objective

Give the aftermarket team one place to price a repair consistently instead of rebuilding quotes from spreadsheets.

Technologies

Power BISQLDAXPower QueryExcel

Business impact

35% reduction in quotation turnaround time and consistent pricing across regions.

Results

  • 35% faster quotation turnaround
  • Consistent repair pricing logic
  • Fewer pricing escalations

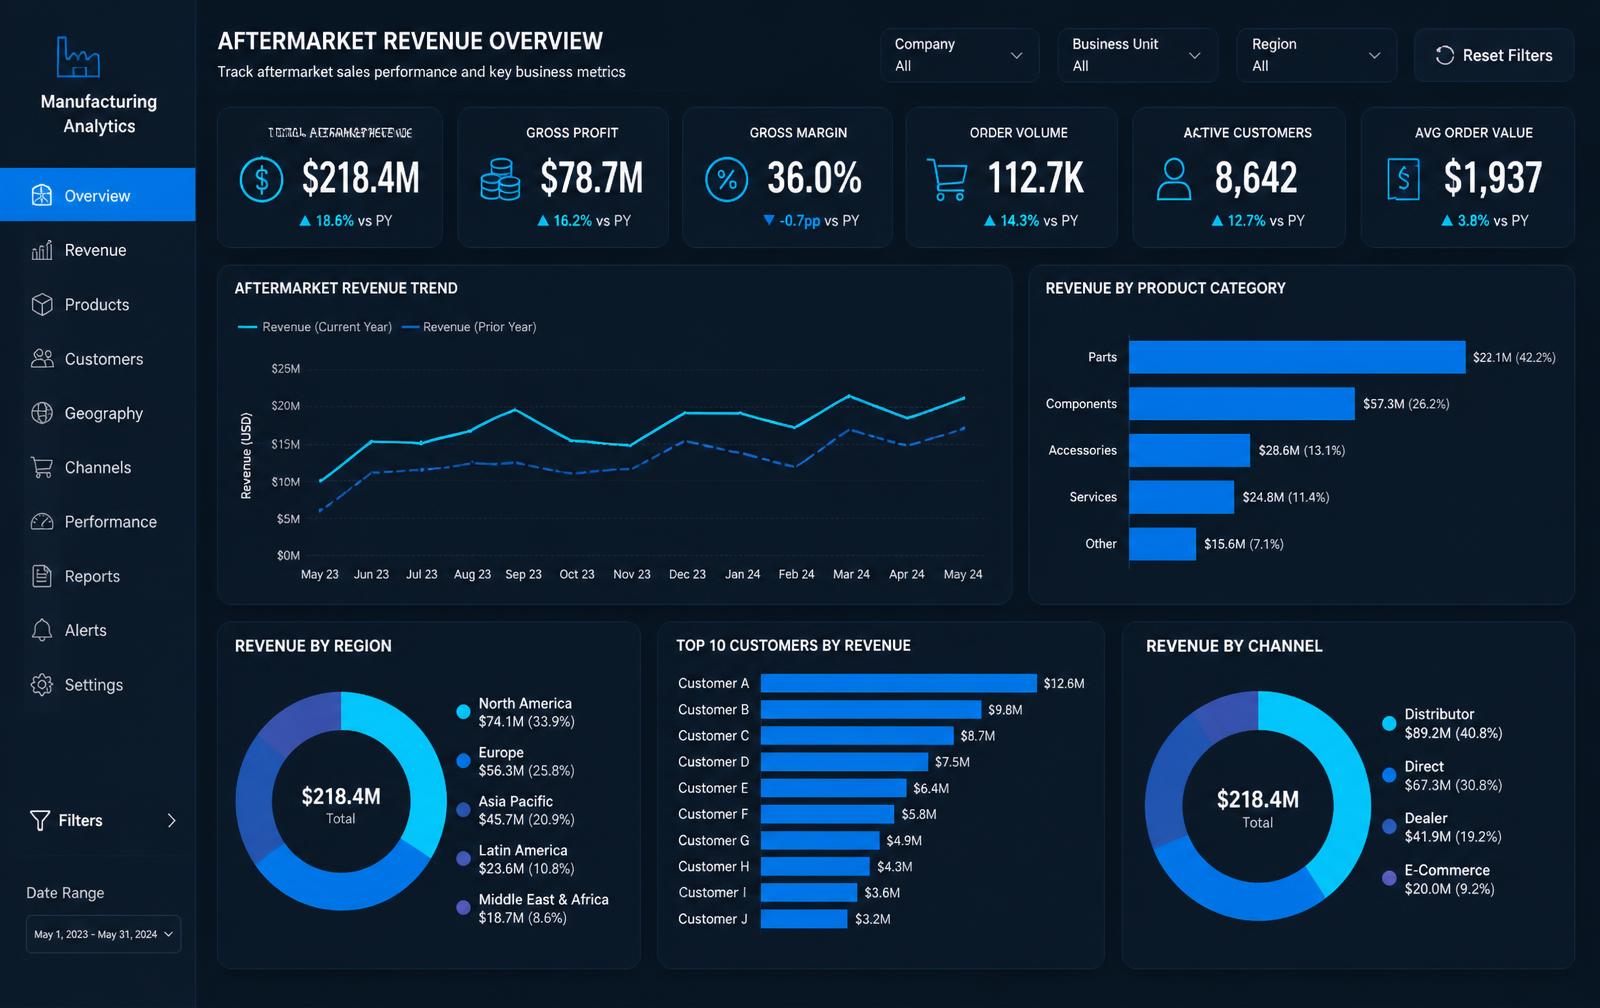
Business Insight 360

Business Insight 360 executive dashboard with KPI cards and trends

Objective

Bring sales, operations and finance performance into one model so leadership reviewed the same numbers.

Technologies

Power BISQLData ModelingSAP

Business impact

26% improvement across tracked business performance measures.

Results

  • 26% business improvement
  • Conformed KPIs across functions
  • Self-service adoption by management

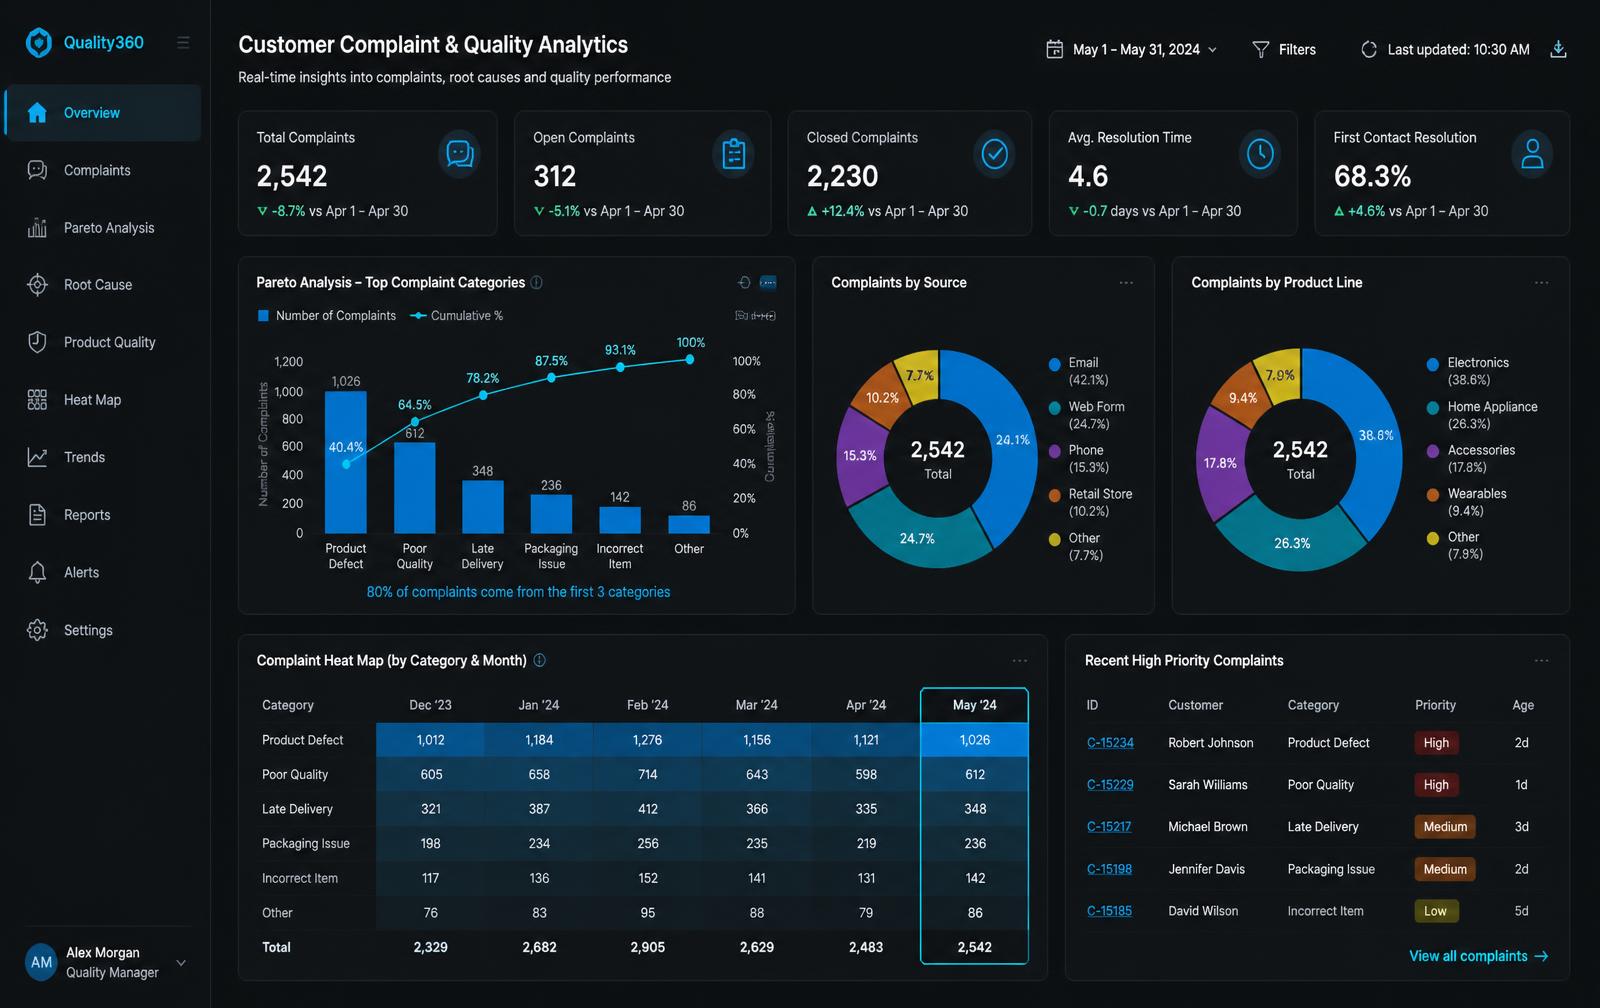
Customer Complaint Dashboard

Customer complaint analytics dashboard with Pareto and trend charts

Objective

Move complaint handling from case-by-case closure to systemic analysis of recurring failure modes.

Technologies

Power BIDAXPareto AnalysisRoot Cause Analysis

Business impact

CAPA effort prioritised on the failure modes that actually drive complaint volume.

Results

  • Top 3 failure modes driving 80% of complaints identified
  • Reduced average resolution time
  • Quality actions ranked by business impact

Operations Dashboard

Objective

Track repair throughput, turnaround time, backlog and utilization in a single daily operating view.

Technologies

Power BISQLExcelPower Automate

Business impact

Daily operating decisions made on live data instead of week-old reports.

Results

  • Live throughput and backlog visibility
  • 96% resource utilization tracked
  • Automated daily refresh

Executive KPI Dashboard

Objective

Give leadership a one-page view of aftermarket and export performance against target.

Technologies

Power BIDAXKPI Framework Design

Business impact

35% reduction in reporting time and a review focused on decisions, not data debate.

Results

  • 35% reporting time reduction
  • Single source of truth for KPIs
  • Drill-through to order level

Power BI Reports

Objective

Replace recurring manual Excel reporting across operations, sales and quality with governed Power BI reports.

Technologies

Power BIPower QuerySQLPython

Business impact

Manual reporting effort removed and definitions standardised across teams.

Results

  • Manual report preparation eliminated
  • Standardised metric definitions
  • Faster month-end close support
WhatsAppLet's Talk